Many thanks to SEMRush for hosting our webinar on Core Web Vitals along with our host, Paige SEO Team Director at ROAST and fellow panellist Riley Content Marketing and SEO Manager at 1-800Accountant.
If you’re interested in learning about the Core Web Vitals Google update then check out the webinar and full transcript below for a review of the metrics and what they may mean for your website.
Webinar’s recording and slides
Recording
Slides
Transcript
Introduction
Paige Hobart – SEO Team Director at Roast
Hello, everybody. Welcome to Core Web Vitals and Roadblocks to Success. My name is Paige. I am the SEO team director at a company called Roast. I am obsessed with SEO. I absolutely love it. I’ve been working in SEO for almost a decade now. That is enough about me. I will hand over to the wonderful Riley.
Riley Irvin – Content Marketing and SEO Manager
Hi, everyone. My name is Riley Irvin. I am the Content Marketing and SEO Manager at 1-800Accountant, so I work in-house. Before that, I worked at an agency as well. I have about five years of SEO experience under my belt. My favorite thing about SEO would be, I mean, I do content marketing, so I got to plug the content, keyword research. I love all of that stuff.
Steve Bailey – Head of Technical SEO at Spike
My name’s Steve. I’m the Head of Technical SEO at Spike Digital. I’m a cat owner, as you can see. I’ve been working in Technical SEO for just over 10 years now. Before that, I was a web designer and developer, but not really that good at website design, so I quit that and just concentrated on SEO.
Core Web Vitals Overview: What and Why
Core Web Vitals and Roadblocks to Success. It’s my view really on why Google are introducing the Core Web Vitals and where I think perhaps they’ve kind of fallen a bit short of what I was expecting. I’ll start off with kind of what Google is doing and why, and then move into kind of an overview of each of the web vitals: the largest contentful paint, cumulative layout shift, and first input delay.
In May, I believe it was, Google came out with this announcement, don’t worry, I’m not going to read through all of this. I’m just going to try and break it down for us. The reason why they’ve said they’re introducing Core Web Vitals is that, looking at page speed and a lot of reporting in the metrics, there’s such an abundance and wealth of them that it can become overwhelming and that makes it inaccessible to a lot of people.
What Google is saying is, with these Core Web Vitals, they want to simplify the landscape, which I think is really good. I think we’ve needed a bit more handholding from Google when you’ve got all of these metrics which one should we look at. It’s focusing on what matters the most.
Google have said explicitly that these will impact on search rankings, search results, and that’s where my interest comes in because I’m involved in technical SEO, getting traffic and better rankings for my clients.
How much is it going to impact? Well, thankfully, Google have been out on Twitter answering a lot of questions about this and they’ve said it’s not going to be a primary ranking factor, that really still falls to the highest quality content and being relevant to results for users and Core Web Vitals has nothing to do with either of those.
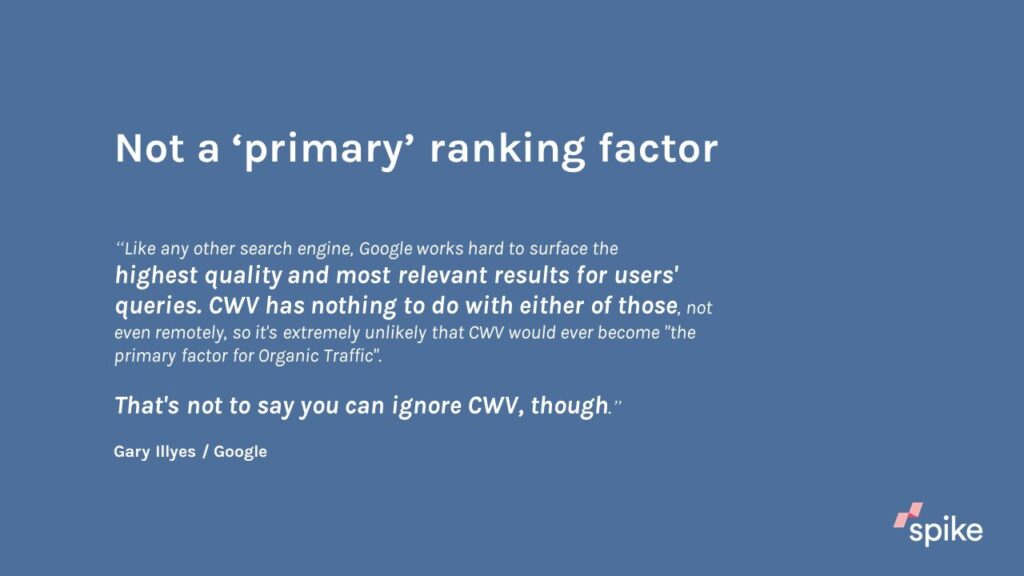
Where does Core Web Vitals really fit in? It’s in and amongst all the other technical factors that we would look at. When I do an audit at Spike, we look at duplicate content, things like that, so I would put it kind of on a par with all of those kinds of issues. It’s not sort of the be-all-end-all of your website.
Let’s just jump into the first of the Core Web Vitals: Largest contentful paint. This has been around for a while, but now it’s been highlighted by Google. What do we mean by largest? That’s the amount of space it literally takes up on the screen. Okay, so we’re talking about screen real estate.
Largest Contentful Paint Explained
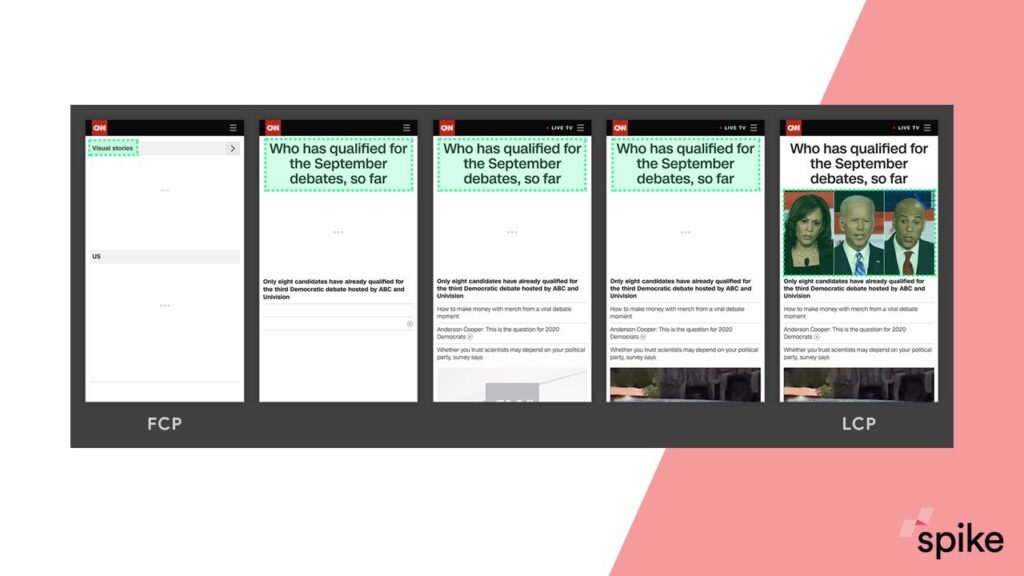
I’ll just run through this one quickly. It’s a frame by frame loading of the page. Google have highlighted in these green boxes what the largest item on the page currently is in each frame. You see by frame two, we’ve got this heading, and that gets replaced in frame five when this image is loaded in. This page is sort of fully visibly loaded at this point and that’s the largest contentful paint or the LCP. It’s that image; it replaces everything that had gone before.
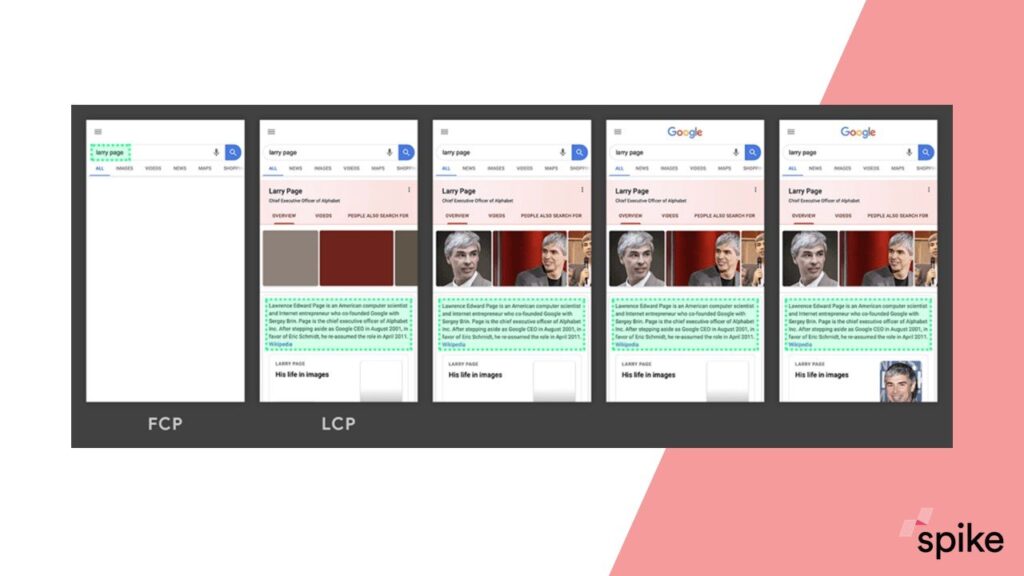
We’ll look at another example from Google. This particular page achieves the loading of the LCP by frame two, which is obviously better than the previous example.
If we look at this in a real-world setting, this example from the watch shop, the timeline, which I’ve sort of truncated here, that’s 3.9 seconds (LCP).
You can get this timeline out of webpagetest.org. I think it’s a really useful tool to be seeing what is going on, how your page is being loaded over time.
You’ve got this title for the Gucci watch, that would be the LCP in those first three frames. But then you get this image pop in. To get a good score for LCP, you need to do it in two and a half seconds.
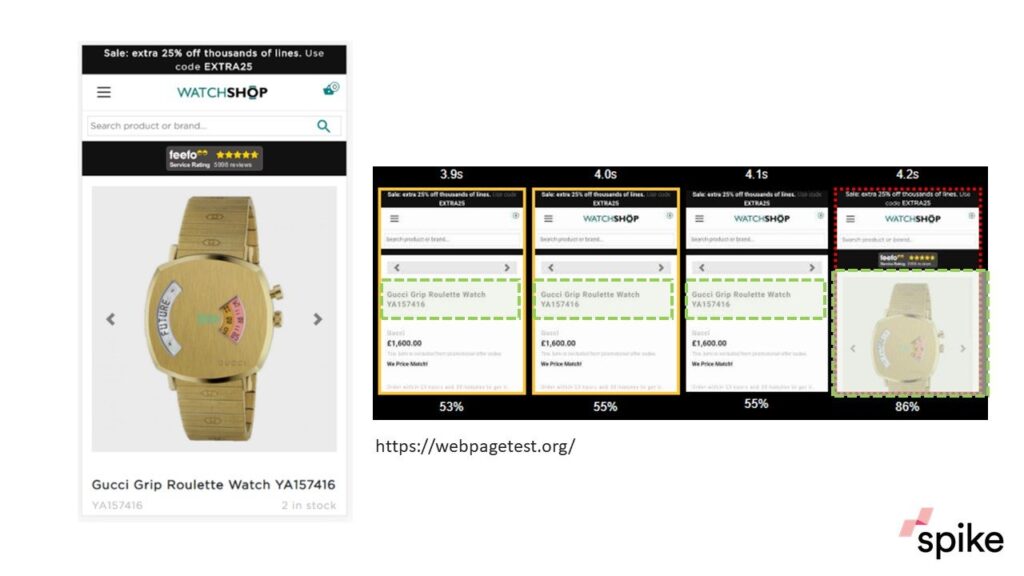
If I was the watch shop, I would be trying to pre-load this image, or get the scripts they’re calling it (because it’s dynamic content) to do that earlier: see if I can achieve it in under 2.5 seconds. That’s an example of LCP and where one website is struggling.
Here’s another example that I think is really going to affect lots of websites. Looking at the racing post, you might not be with your eye be able to determine what is going to be the LCP for the page. It’s this cookie pop-up, which so many websites have now.
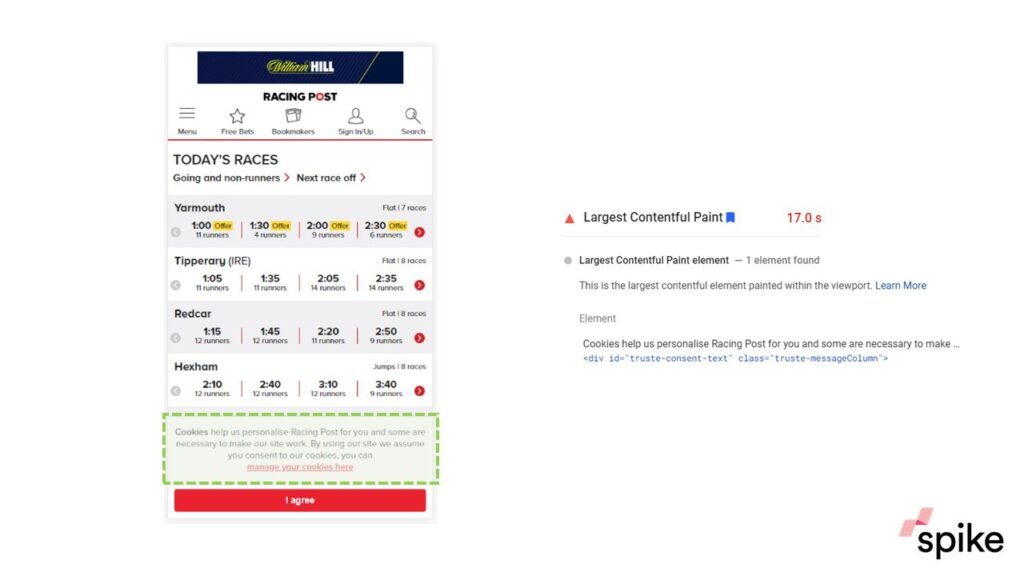
The problem with cookie pop-ups is that they almost exclusively load as the very last item. Everything else is rendered on the page, then the cookie pop-up happens. This gives the racing post a really bad score.
Because this cookie notification comes in late, that’s going to give the Racing Post a poor score. One thing to look at, if I was Racing Post, well, when it comes to blocks of text, Google looks at paragraphs, individual paragraphs, this is one paragraph, they could split this into two paragraphs.
Maybe that would mean that the cookie notification would no longer be the LCP, but they’d have to play with it or maybe just reduce some of the text. This I think is going to trip a lot of people up because it’s so commonplace.
Talking about how much I trust in the tools, when I’ve been researching this, I’ve found a lot of problems. This Metro desktop view, for example, when I looked at Chrome DevTools, so Google are telling us to use Chrome DevTools to find out about your LCP, and it detects the Metro logo as the largest item on the page.
That’s just nonsense, quite frankly, because I’m sure the image is certainly bigger and every single tool that Google are telling me to use seems to be blind to adverts, which I don’t think is good. I don’t think that’s helpful at all.
If I can’t trust them with tools, that makes it quite difficult for me. I would give Google performance score of 67 out of 100 for this. I really like LCP. I think it’s simple enough for people to understand and access, but in terms of the tools that we’ve got, how we can interact with that’s going to try and change it, I don’t think it’s as polished as it could be. But it’s still a good start.
Cumulative Layout Shift Explained
Moving onto cumulative layout shift. This is something that everybody will have experienced when things move around on the page and you might not be able to keep up with it. Here’s an example from Hello Magazine. That page looks perfectly fully rendered. Maybe I’m about to click on one of the articles in that sort of middle strip, and then suddenly you get a space appear above all the content that has already been loaded that shifts everything down.
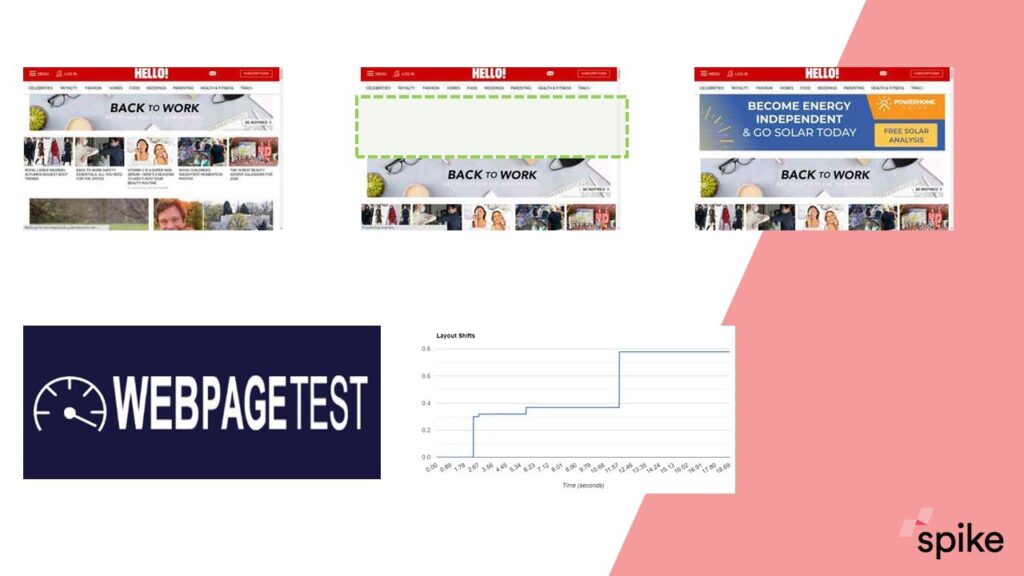
I think the websites that have a lot of adverts on their site, they’re going to be impacted on this potentially more than most. It’s really frustrating for the user when you’re about to click on something and it moves. Again, I would say the best place to go and really look and research your website, client websites, would be through webpagetest.org because that gives you a chart that shows you the layout shifts over time and the timeline, so you can see exactly where it’s occurring, which is really, really useful.
If we go back to the watch shop example, so we know they’re already having a bit of a bad day with largest contentful paint, well, let’s look at layout shift now. As the page is loading, we’ve got all of this information about the watch name, about the price, and so on. When that image loads in, well, that’s going to shove everything that we’ve been looking at out of view.
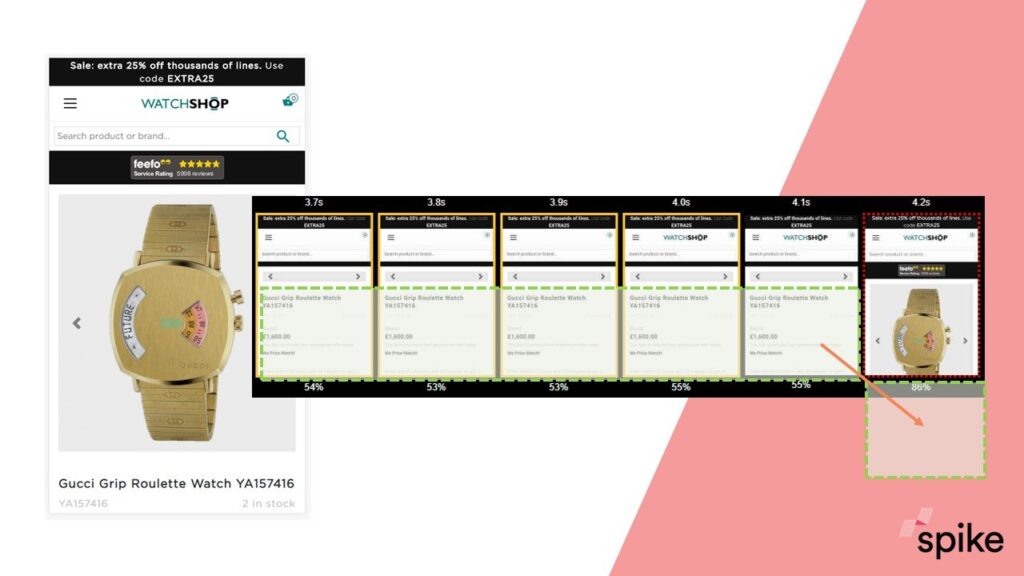
That’s a huge amount of layout shift being caused by the late loading of this image, which again is a problem for the LCP. It’s kind of a double whammy for them, something that they really need to sort out.
I think probably my go-to solution for layout shift would be similar to this example that I’ve got from LADbible. The page hasn’t fully loaded yet; you’ve got this grey box that’s under the navigation and an advert is going to go in here. What they’re doing is they’re reserving the space for that advert and they do it just by using CSS.
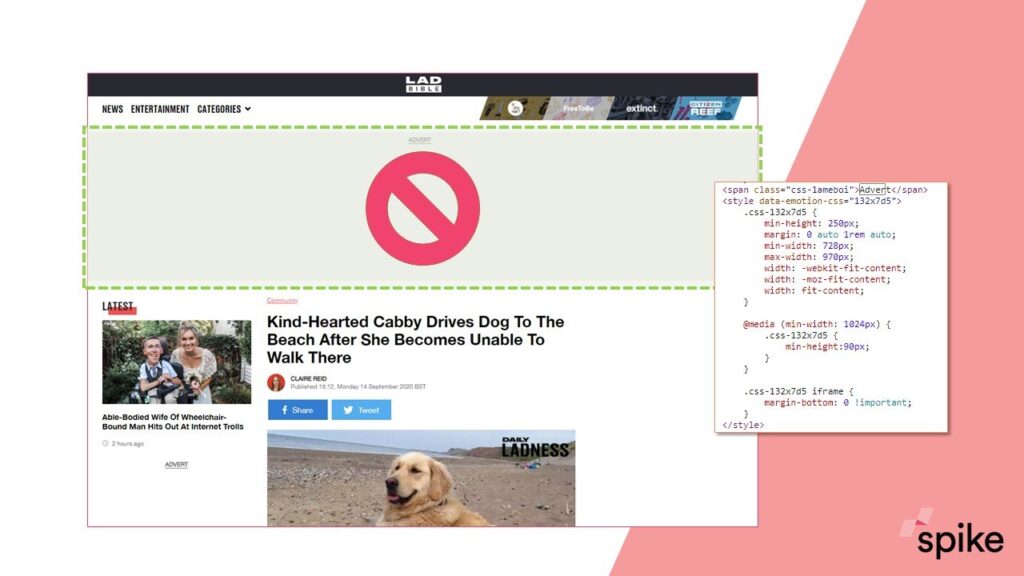
They know the minimum height that they need for their advert, 250 pixels. They use CSS and they essentially block out that area so that the article below it can’t load up any higher. That article when it’s loaded is not going to be moved around by a late loading of an advert.
This, like I said, would be my go-to solution. Probably even for the watch shop, because if you know the dimensions, if you know how big your product image is going to be, then you could reserve that space. You can entirely eradicate layout shift because of that image using this kind of practice.
For layout shift, I would give Google a slightly higher score of 79. I like the fact that Google have brought layout shift sort of into all the other metrics that they’ve got. They’ve never really talked about it too much before and it’s always kind of been for UX people to look at, but I like the fact that they’re highlighting it now.
Again, I think without webpagetest.org, we could be a bit lost in trying to analyze it. I’d like to see the tools a bit more polished so that we can really dig into this and fix websites a bit quicker with good tools.
First Input Delay Explained
Finally, we have first input delay. First input delay, again people are going to experience this from time to time on the internet, when you click a button or when you try and interact with a website and nothing happens, it’s very frustrating from a user’s point of view.
The way I try and explain it to people is it’s like phoning up customer service and you get put on hold, and the reason why you’re being put on hold is because the customer service operator is already dealing with a different request, a different customer. And it’s very similar for your browser.
Google’s example and it’s not very visual, I’m afraid, but you’ve got this main thread so this is the browser processing different elements of a page over time. It’s busy during these periods, these sort of yellow blocks here. If you click at this period where the browser is currently busy, then you have to wait until it is finished with that particular task and then it can respond. First input delay is the amount of time it takes for the browser to finish that task and then respond to you.
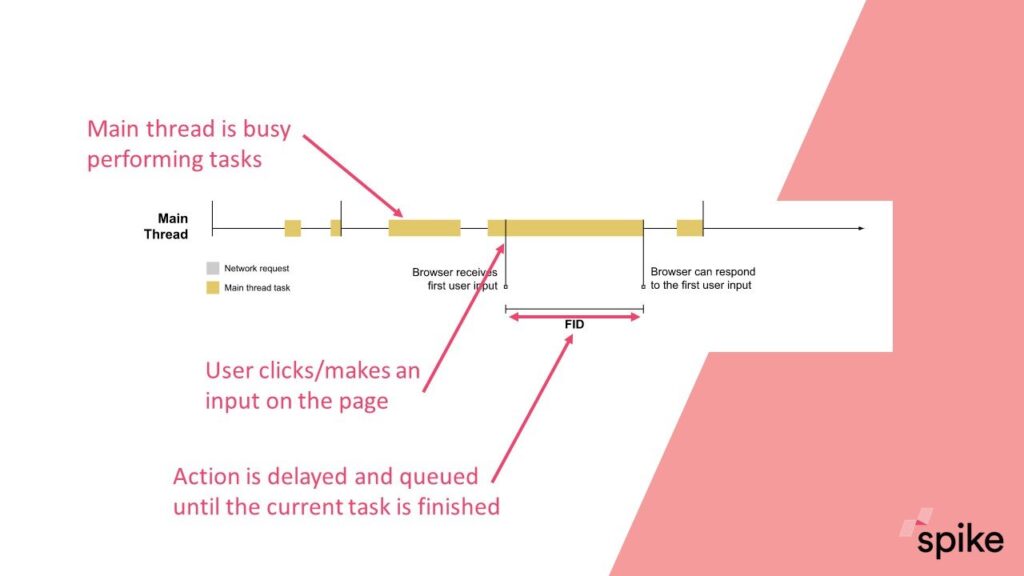
The interesting thing from the first input delay is that this can only be measured with real-life users. Because when I click or when you click, that will be at different points in time, so you need real live data to actually analyze your site, unlike cumulative layout shift and largest contentful paint.
There’s three tools that you can access that data from. Chrome user experience report, PageSpeed insights, and Search Console will report on first input delay. I give you data like this which is, I think this is PageSpeed Insights, so it’s 28-day aggregated data.
I don’t like first input delay because I think it’s really difficult to engage with. It’s not a new metric. I’ve found a lot of sites that got stuck with it in the past and haven’t been able to really deal with it.
What I’m finding is that most websites score very well, so it’s not a problem for them. But if it is a problem for your website, then the place to go and look would be in Chrome DevTools. When you’re looking at data like this, so the performance reports within DevTools where you’ve got all these scripts that are running and you need to try and identify which ones are taking a long time and potentially blocking the browser from responding to a user input, I would say that this gets really technical quite quickly, unlike the other two.
Because I don’t like it, I’m going to give Google a score of 16. It’s nothing new, people who were stuck on it before will still be stuck on it now. I can see why they’ve included it because it is one of those really annoying things that happens as a user. But I don’t think that at the moment they’ve really improved how we can access and make changes to a website to improve scores on that.
How Important Are Core Web Vitals?
To wrap up, I’d like to go back to a previous point about how important core web vitals are. I think a lot of people will be receiving emails that, “All your core web vitals are really bad, buy our service now.” At Spike, we think, yes, they’re going to be important, but we’re going to put them alongside so many other of your technical fixes.
It’s just one element of technical SEO. Don’t panic over these. Certainly, have a look at them, but your content might not be up to scratch. You might need to get more products on your website, whatever it might be, and that may be a better place to focus your time.
Paige Hobart:
Thank you so much. That was so interesting and really, really helpful. Riley, have you had any communication from your colleagues or from potential agencies to say, “Oh my god, these are really important, you should do this right now.”
Riley Irvin:
Everyone in the industry I’ve talked to is like, “Yeah, this is cool, it’s a nice tool,” but as far as it rolling out in SERP, we’re not necessarily confident it’ll change all that much. It’ll kind of just be another tool in our belt to make sure that the content is, make sure that the pages are ranking as they should be.
Paige Hobart:
Absolutely. I completely agree. At least two of those metrics are just speed metrics. Speed is something that we’ve been talking about for forever and a day in SEO; making sure your site is fast. I think these two new metrics, LCP and first input delay, they’re helpful in potentially making speed a bit more accessible by Search Console. I do think you’ve scored CLS quite low, although based on all three, it was quite high. And that is your favorite, right?
Steve Bailey:
It’s my favorite because, like I said, I don’t think Google have really talked about layout shift very often in the past. I’ve always been aware that it’s a UX issue. The one sort of commonality between core web vitals is that they are user-centric.
That’s why maybe time to first byte or those kinds of metrics haven’t made it in. These all frustrate users more so than others. I really applaud them for bringing that in.
Tips for Diagnosing Cumulative Layout Shift Issues
Paige Hobart:
Awesome. We’ve got a couple of questions on CLS. Firstly, is there a way to specifically tell on my page what is causing CLS? Riley? Steve?
Steve Bailey:
No, there doesn’t seem to be. If you use webpagetest, then you can break down the timeline into… I think it’s 0.1 of a second. You can get a lot of frames out and it gives you a chart of when it detects them. You go and look up as closely as you can to that frame and it will show you visibly.
Sometimes it’s obvious, so with adverts, I think that you get massive space. Or with that example from the watch shop where it’s quite clear, there’s images that’s just shoving everything out of the way. Then you can go and say, “Okay. Well, when do I load that image in? How do I load it in? And how can I give it a higher priority?”
Outside of that, I think DevTools now has layout shift built into it. But that doesn’t always seem to turn up on mine. Where is it? It’s there for one of my sites, it’s not there for another site that clearly has layout shift. What’s going on Google? I’m not happy with it.
Paige Hobart:
Yeah, sometimes I’ve seen the big red bar in Chrome DevTools where it says this is where CLS is happening and you can match that up with the trace with those frames in Chrome DevTools and say, “Okay.” But it is a challenge right now, the tools aren’t perfect.
Steve Bailey:
Yes. I think it will be obvious to some people when they’re looking at their site. I think again with those kinds of cookie displays, the ones that shove everything down from the top, that’s almost like loading an advert above content.
Common Page Elements That Cause Poor Core Web Vital Scores
Paige Hobart:
We’ve had a question from Andy Simpson, “Do you see common on-page elements that affect core web vitals such as banners and things?” I think you’ve already captured images, videos, cookies pop-ups, obviously ads. Anything else you guys can think of that might cause, well, any of the issues really I guess?
Riley Irvin:
I would say, if you don’t optimize the image well, especially for LCP, then that can be a bit of a problem. I think, depending on what kind of website I was working on, if it was a news sort of website, I might start leading with more blocks of text content because text is just super quick.
Why have a featured image that’s pushed all the rest of your content down? Why not put in your heading, a good paragraph or introductory paragraph, and then put your featured image in? I’ve seen some websites do that really well. It gives them a brilliant score for LCP.
But in terms of kind of common problems, then I think it is… anything that is delivered via a script. Adverts are a big offender because that all gets called late in the day. But also looking at that watch shop example, because dynamic content has been built, they need to look at how early they’re calling that image and dealing with that quicker because their scores for those two metrics I think are very poor.
If they’ve got a good dev team, they should be able to do that. That’s the most kind of common thing. I think a lot of images in blog posts or whatever are probably fine. You’re looking at 2.5 seconds, so most web pages quite easily hit that.
Paige Hobart:
Awesome. Have you found the Search Console interface for these elements helpful when talking to non-SEOs?
Riley Irvin:
Yes, to a degree. I think that particularly the graphs are super helpful because it really breaks things down in terms that I can sometimes be a little too highbrow for. When I’m talking to the higher-ups in the company, it’s easier to be like, “Look, we have this many really bad URLs that we need to fix,” whereas if I’m just over here talking about LCP or CLS, they’re going to be like, “Why does that matter?”
Prioritizing Performance Metrics for Mobile vs Desktop
Paige Hobart:
One more question from Dan Goldberg, “Would you prioritize these for mobile or for desktop?”
Riley Irvin:
Yes, there is, when you go into the Core Web Vitals report. Mine, in particular, has a big difference between what shows up on desktop and what’s on mobile and I was actually surprised at how different the scores were between the two.
As far as what to prioritize, I’m always going to say mobile because mobile-first is rolling out. But I don’t think it’s worth neglecting desktop. Steve, what do you think?
Steve Bailey:
Absolutely. Mobile and desktop, it’s different screen sizes. In DevTools, you can select Pixel 2, or Responsive, or iPhone or whatever and you might find that you’re receiving more layout shift or what have you, depending on individual devices.
Google Search Console, that reports on desktop pages and mobile pages and you can see a big difference between the two of those. If you look at that watch shop, for example, if you’re looking at it on a desktop view, you’d have the image over one side and the text over the other side. That image is no longer shoving everything down. You’ve instantly fixed that on desktop by not doing anything at all.
I definitely need to look at both areas, but, as Riley said, you if I was going to choose one to prioritize, it’s very unusual these days that I look at desktop first. You know, everybody’s using mobile.
Paige Hobart:
Yeah. Controversially though, I would say check your GA data because, I don’t know about you guys, but we’ve seen a huge increase in desktop traffic because we’re all working from home. We’re less on the move, we’re not doing as much, suddenly desktop is just as important, if not more important than mobile for some people.
Core Web Vitals and AMP Pages
I guess while we’re on the topic of mobile, one thing I want to ask is about core web vitals impacting AMP, a personal topic of mine that I quite like to talk about, but I’ll get you guys’ opinions first.
Steve Bailey:
I think pages will potentially still be impacted by this. They shouldn’t be because everything should be super quick and delivered by Google. But a lot of pages featuring adverts, I don’t think those adverts are delivered by AMP. So it’s still going to have a bit of an impact.
Paige Hobart:
I personally absolutely hate AMP, so if anyone watching I’ve always advised clients not to use it. Every single time a client of mine has tried AMP, it has gone horribly wrong, their rankings have dropped, they’ve not been able to track it properly. Riley, have you used AMP at all?
Steve Bailey:
I’ll defend them a little bit. Actually, we’ve had one client, not in the news sector, who went on to AMP and they did get a lot of traffic. It did cause us quite a few problems. It’s never an easy thing to introduce, especially with tracking and things like that, but it was quite good.
I think from a news point of view, that it’s still going to be quite a useful thing to get into. But with regards to core web vitals, I think you test them as well. You have to test those out pages separately because they’re being delivered in a slightly different way.
Collaborating with Developers on Performance Metrics
Paige Hobart:
Yeah, I completely agree, absolutely. We’ve had an interesting question from Ethan. “What’s the best way to format and share core web vitals issues with developers?“
From my experience, because these are quite new metrics, I created a meeting with my client developers where we already knew that we were taking these metrics with a pinch of salt because they’re new. We didn’t want to panic.
We came at it from a very collaborative approach. We went through the metrics, pulled out some pages, dug into the data of it all together because they know things that I don’t, I know things that they don’t. That’s how I approached it and we ended up prioritizing based on what they knew they could fix; and what stuff that was going to be quite difficult to fix. How about you guys?
Riley Irvin:
I’d honestly take the same approach where I would spend a lot of time with the developers and do exactly what you were talking about, figure out what would be easy to fix and what if we removed might be detrimental. I would definitely take a very collaborative approach, see what you can fix, and how it will affect everything, what you can fix fast, and then just keep testing.
Steve Bailey:
Yeah. I think with it being new, it’s interesting. The best thing, as you both said, is really to talk to the developer, to the interested parties, not make a huge deal out of it to begin with.
There’s no urgency at the moment because we’ve got at least six months before this kicks into being a ranking factor. But we’re trying to use that time wisely and we’ll work through it together, and then when they’ve come up with a solution I’ll steal it from their devs and give it to my other clients as well.
The Weighting of Core Web Vitals
Paige Hobart:
Do you think each of the vitals gets the same weighting?
Steve Bailey:
I’m not certain because Google, when they launched Core Web Vitals, they didn’t say if any one of them was going to be more important than the other, but if you run a Lighthouse report and you click on the weightings of that, I think CLS is five percent, whereas first input delay is 15 or 25. Whether the Lighthouse weighting is going to be Google’s eventual weighting for these, we don’t know. But I wouldn’t be surprised if they weren’t weighted or taken up the same.
Paige Hobart:
Yeah, that’s interesting. I did not realize that that was 15 percent versus five. I would have thought layout shift was hugely more important to users than that. But I guess, like you said, speed has been an important part of this for a long time. I guess, look at Lighthouse, it literally tells you which things are going to save you the most time and flags the highest value things.
Riley Irvin:
As far as the weighting goes, I mean, I’m with you guys, I think that it wouldn’t surprise me if they were all weighted differently as they’re rolled out. I bet that one of the reasons that they haven’t necessarily told us what the weighting is yet is because they’re still waiting to see how things roll out and what the bugs are.
We talked about one of the issues can be your cookies pop-up flags these and I wonder if Google will ever be able to fix that and if it will change the weighting of those particular scores that are getting flagged because it’ll be such a common issue.
Other Website Performance Metrics, Reports, and Lazy-Loading
Paige Hobart:
Do you think this will make the PageSpeed Insights report obsolete? I think that this makes it even more important. What do you guys think?
Riley Irvin:
I agree. I think they should definitely be used in conjunction because, as Steve kind of talked to, the tools themselves are kind of flat when you go to actually diagnose the issue. My gut would be to use everything kind of together to see what commonalities you can find to even diagnose the issues in the first place.
Paige Hobart:
Yeah, absolutely. I mean, I use the webpagetest.org as you suggested, Steve, Lighthouse, of course, I think GTmetrix is another one that we use. I’ve used something called Varvy, which is really good, quite user-friendly. There’s so many page speed tools out there.
Steve Bailey:
Yeah. I think as well for the other metrics that are all in Lighthouse or webpagetest, so time to first byte, they’re all still relevant. Even though Google has said, “We’re going to simplify the landscape, you only need to look at these three,” well, the more I look into it the more I think it’s a bit nonsense really.
Because if your time to first byte takes two seconds, then that two seconds influences the four seconds to load in your LCP. To actually fix the loading in of your LCP, it might be to sort out a problem with your server not responding to requests as quickly as it should do.
Paige Hobart:
I think you mentioned the Chrome user experience report a little bit earlier. I would definitely recommend anyone looking into this. Use that data because that’s actual user data rather than just being pinged by any one of these tools. It will actually show you users interaction and the kinds of issues that they’re seeing.
I think with speed there’s a really interesting concept about, yeah, you can make it super fast or you can make it look like it’s super-fast, and that’s when you get things like lengthy loading and stuff that’s happening somewhere else. It’s all about that kind of perception.
Steve Bailey:
Lazy loading, yeah, that kind of thing is really important for websites. I think it ties in with when you look at LCP, it’s kind of this imperfect measurement of page speed. Because the problem that they’ve had in the past was saying, and we have this problem when we’re talking to clients about it, so Google have scored your page really badly for page speed. And it’s because Google have usually judged page speed on the last thing to load.
The more that you can do things like lazy loading, pre-loading of scripts, pre-loading of images, or setting those priorities of when things load in so that really you’re giving the user as much of an experience really quickly and that’s where Google are trying to move us.
I think that’s the perfect way to do it because some pages have huge things they need to load just for the functionality of something they’re trying to deliver. But if it doesn’t really impact my experience on the page, then why should we be judging that page as loading slow when I’ve not noticed it at all?
Paige Hobart:
Yeah, absolutely. It’s really interesting concept when you talk about page speed because we’re only looking at the bit that’s loading in the screen in that moment. Anything can be happening off of there, we don’t really care as long as the thing that we’re reading or looking at, that’s fine.
Awesome. Well, we’re coming to the end of this very lovely webinar. Thank you both for joining me. This has been super, super interesting. Steve, thank you for presenting.
Steve Bailey:
Thank you.
