
| Holiday Cottages (UK) Social Media Engagement Analysis |
| Hotels (UK) Social Media Engagement Analysis |
| Health & Fitness (UK) Social Media Engagement Analysis |
| Jewellery (UK) Social Media Engagement Analysis |
At the beginning of the year, Socialinsider, a social media analytics tool, has come up with a benchmark study, through which the latest trends regarding the engagement on social media for some major industries were looked over.
The UK market is a buoyant ecommerce space and so we have delved into the data, at a national level, with some selected sectors of interest.
In order to have a better understanding of the regional landscape, Spike and Socialinsider, have partnered to look at trends across Facebook and Instagram, in particular. Furthermore, both brands looked into how integrated marketing across social media and PR, drives brand awareness and backlinks, through social media campaigns.
Known for its touristic potential and powerful investment in this particular segment, a couple of industries such as holiday cottages and hotels were analysed for this research.
The health & fitness market, as well as the jewellery market, were taken into consideration in order to understand how the behavioural patterns of consumers changed over and after the social context of the pandemic.
Overview of the social trends in the UK market
- Instagram has an average engagement rate 4 times higher than Facebook’s
Facebook has come a long way since it’s initial release, and nowadays, despite being the biggest social media platform, is struggling with keeping its users engaged.
One of Facebook’s strong points, from a marketing perspective, is that it remains the platform with the highest CTR, which makes it perfect for advertising purposes. This provides brands a clear opportunity for data capture through the running of paid competition posts as just one example, which help to enable users to leave comments and provide opinions that can then be utilised by brands from a PR perspective.
But with so many ads out there, the average engagement rate suffers a decrease that translates into values of 0.39%, four times less than Instagram’s, which has reached 1.51%.
Another major advantage of Instagram for gaining this rate may be the many interesting and cutting-edge features introduced, and the younger audience attracted because of them. Content across Instagram is easily digestable across younger audiences, and this allows brands to capture the opinions of audiences quickly when reacting to live events in the news, thus fueling the proposition of reactive PR.
- Images are the most used type of content on both platforms
Whilst having ownership of almost half of all the posts sent and is still a great way of gaining people’s interest, in the growing era of video marketing techniques, images may start to fall behind in providing excitement to the communities, a thing that social media managers must take into future consideration. With the launch of TikTok previously in 2017 on iOS, this became a gamechanger for the preference of video content vs imagery from a marketing and advertising point of view. Now with such platforms offering ‘quick-fire content’, imagery can fall risk to being too disengaging for younger audiences.
- Friday is the most engaging day for Facebook and Instagram
Given the fact that Friday is probably the most beloved day among them all, with people starting to think how they are going to spend their weekends, and maybe looking on social media for ideas of getaways or places to hang out, it’s no wonder why it’s the most engaging one.
When examined in greater detail, to the hour level, it seems that around 5 PM is the best choice for both platforms, when people engage the most.
Industry Examples
Now we’ve seen a grasp of how the digital landscape looks for the UK Market, in order to have a better understanding of the trends and all the insights presented, we thought about explaining the results via some concrete examples.
Holiday Cottages

When it comes to the accommodation market, in 2020, on Facebook, holiday cottages had an almost doubled level of engagement when compared to hotels. This may be because given the social context, people tried to be more isolated and therefore cottages fulfilled this criteria more than hotels.
https://www.facebook.com/sallyscottages/posts/4177405348968997
The beginning of 2021 has brought a reason of joy for brands from this segment, with the average engagement rate increasing up to 2.26% on Instagram.
Still, after reaching this peak, through the first quarter of 2021, the line has started to decrease back, till 1.70%.
So, is there a chance for the average engagement rate for this market to revert back to the values from 2019, prior to the pandemic, as this Instagram study shows? – That’s something that still remains to be discovered.
Whilst there had been some growth in social engagement on Facebook as well, this was followed by a significantly decreasing rate, with values falling to 0.87% engagement.
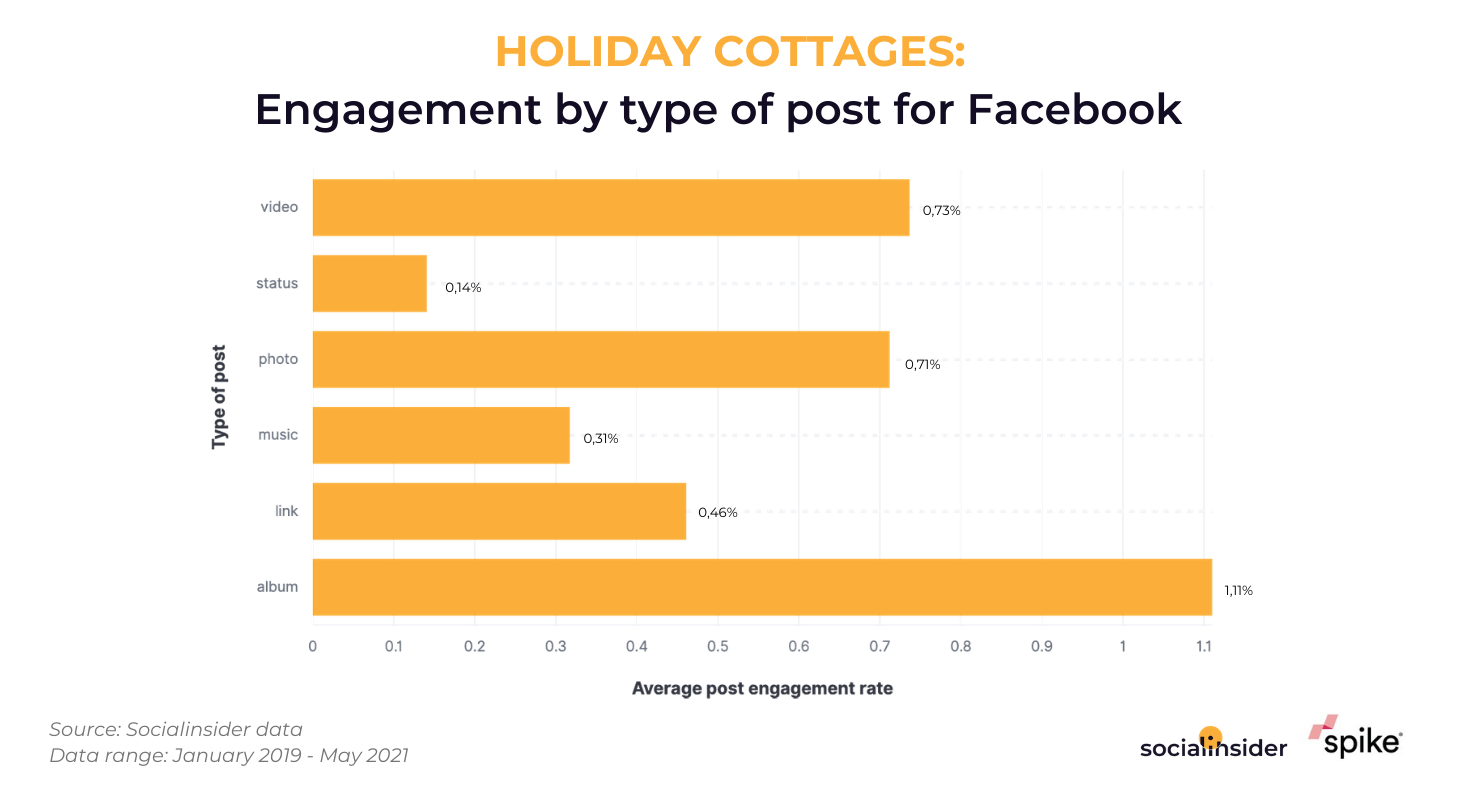
By choosing to post more albums on Facebook, brands from this industry can increase their average engagement rate up to 1.1%.
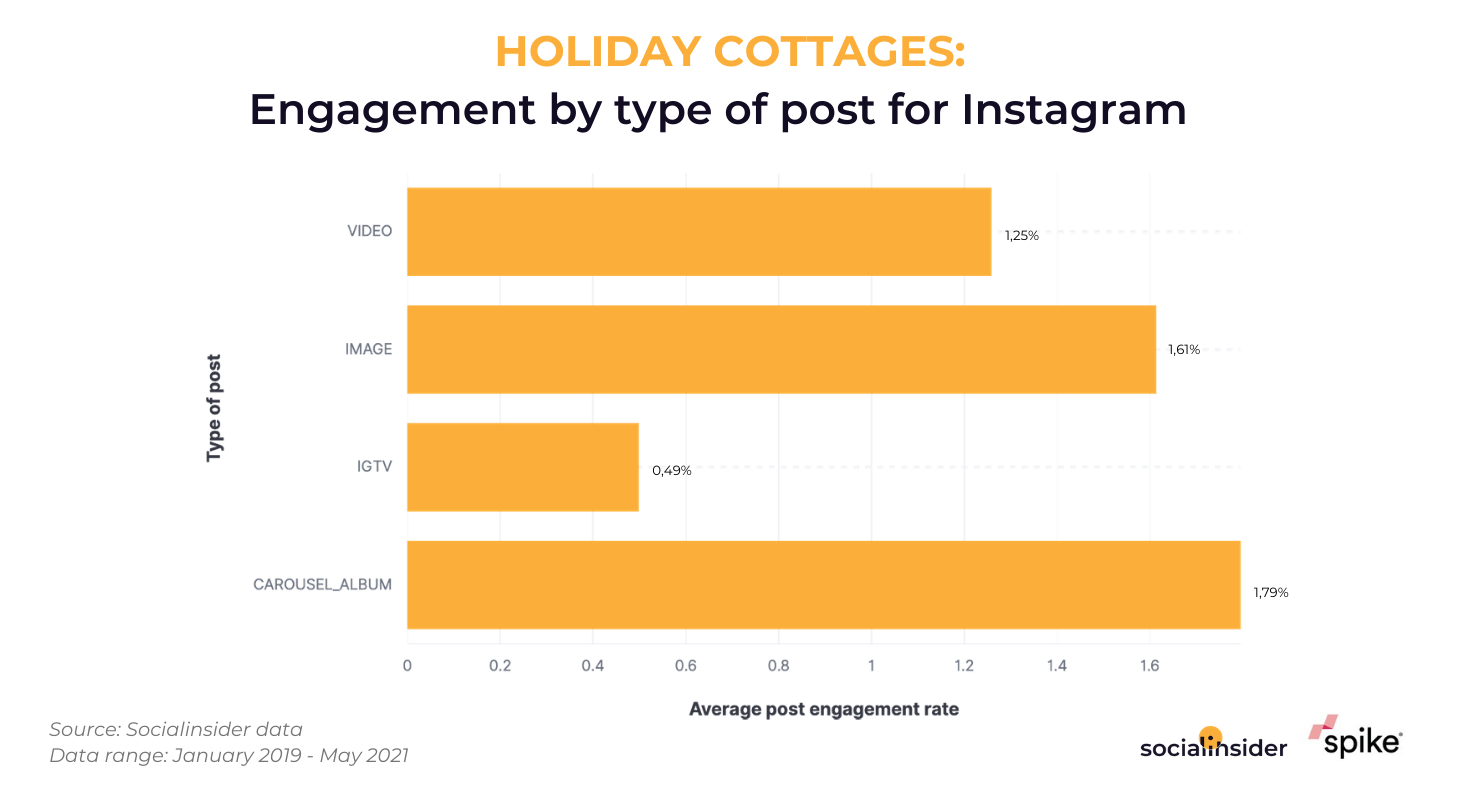
The tactic works on Instagram as well, since carousel is the type of post capable of generating an average engagement rate up to 1.6%.
Hotels
Having gained awareness about the importance of a social media presence, the hotel industry has also leveled up in terms of digital performance.
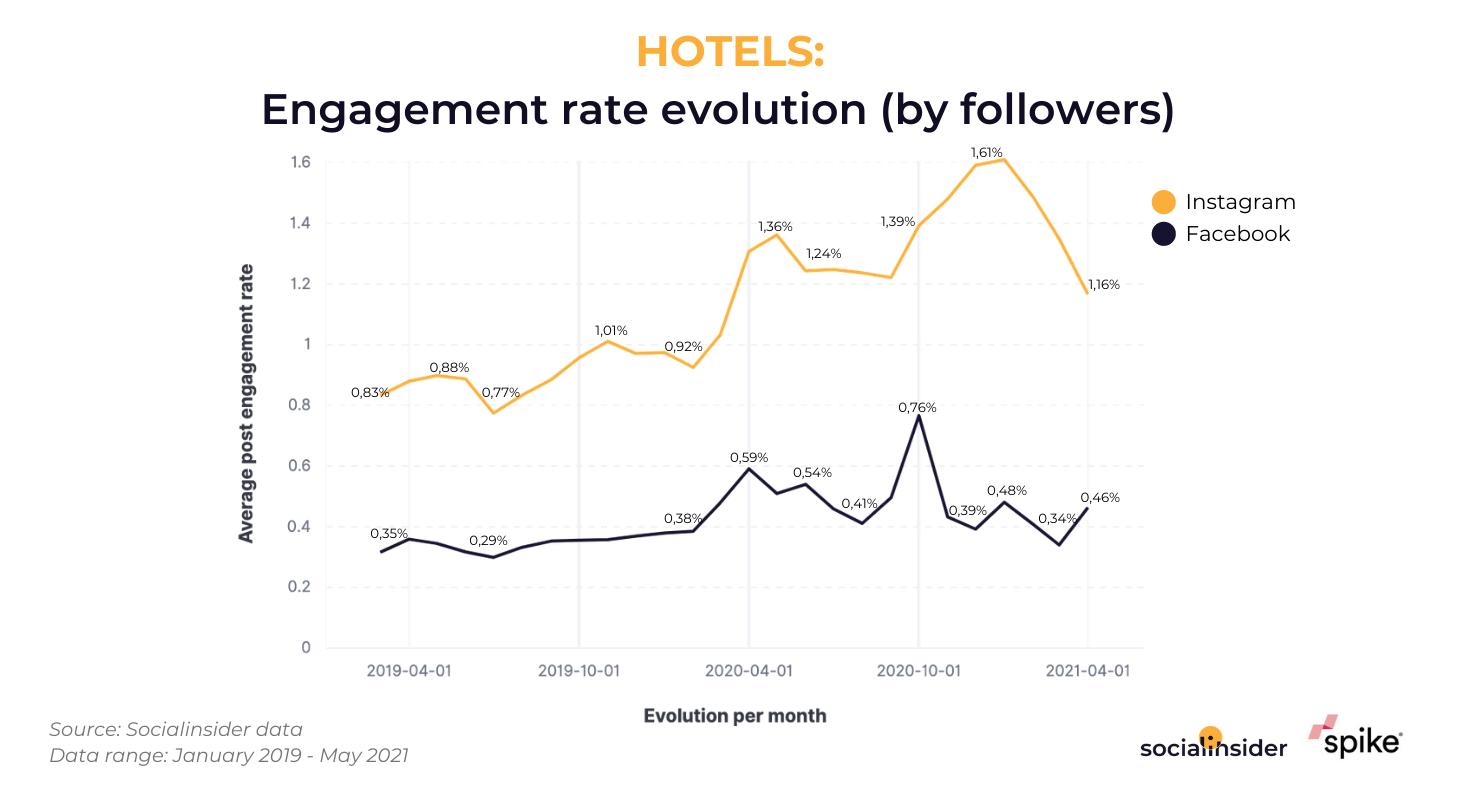
Back in 2019, the Instagram engagement rate indicated a poor 0.83%, but along the way brands seem to have found the right path, nowadays reaching values of 1.16%.
The situation we saw earlier, when investigating the holiday cottages market, was applicable for hotels as well, which have also seen a spike in engagement at the end of 2020.
Although Facebook’s values are pretty far behind, on this platform, there has also been evidence of some improvements.
Starting with the second quarter of 2020, there have been a lot of ups and downs, at the moment the average engagement rate for hotels on Facebook being located somewhere around 0.46%.
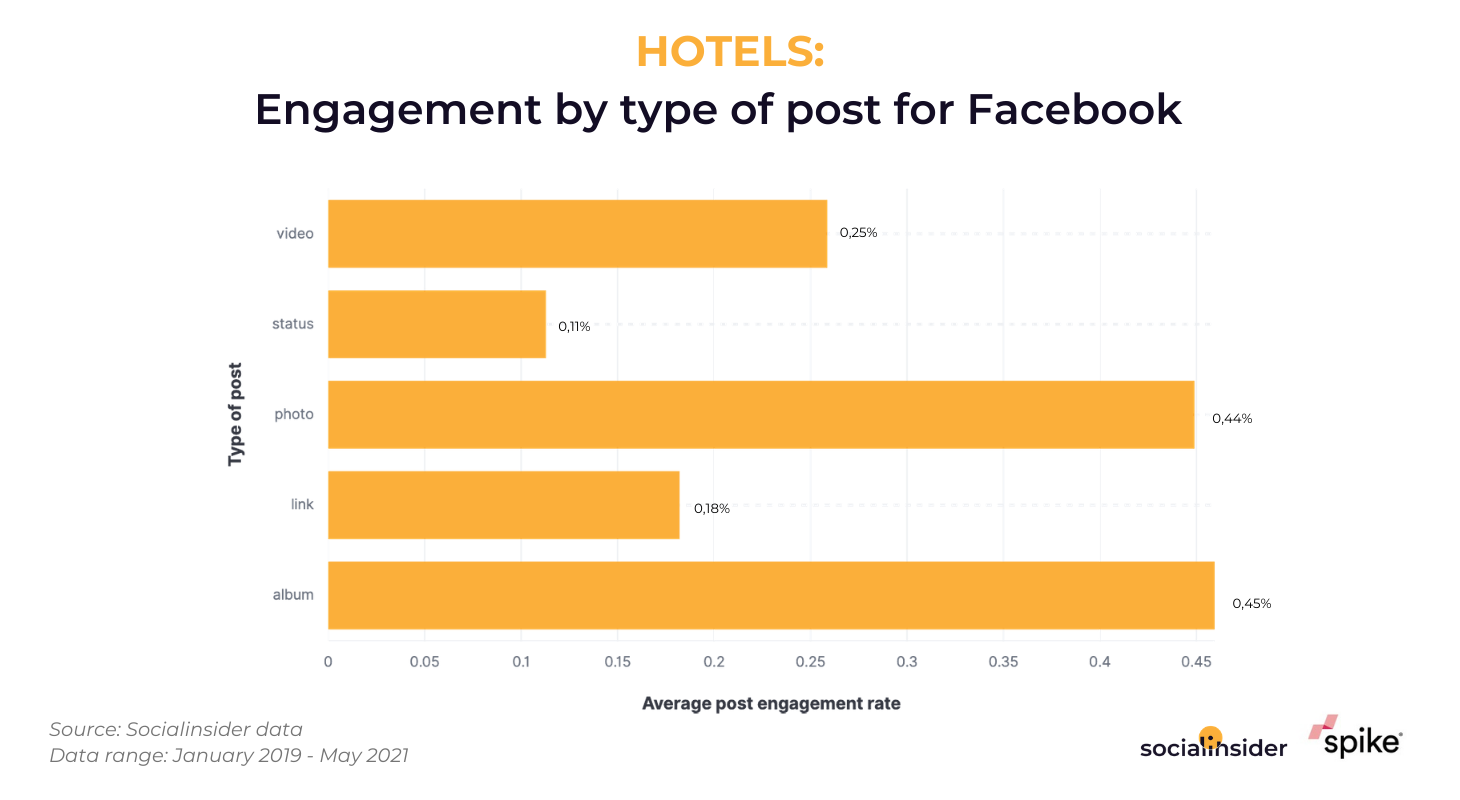
In the hotel industry, there seems to be a draw between albums and single images, both of them having the capacity of generating an average engagement rate of 0.45%.
So, in this case, a content plan that mixes these two types of posts seems to be the ideal strategy needed. This is exactly where brands can capitalize on an integrated approach to launching campaigns across social media, may that be polls, competitions, post tagging, and utilise the data within PR campaigns. A dual approach is often a great way to offer a journalist an additional insight into what audiences are thinking, which is not something the media are able to attain readily themselves.
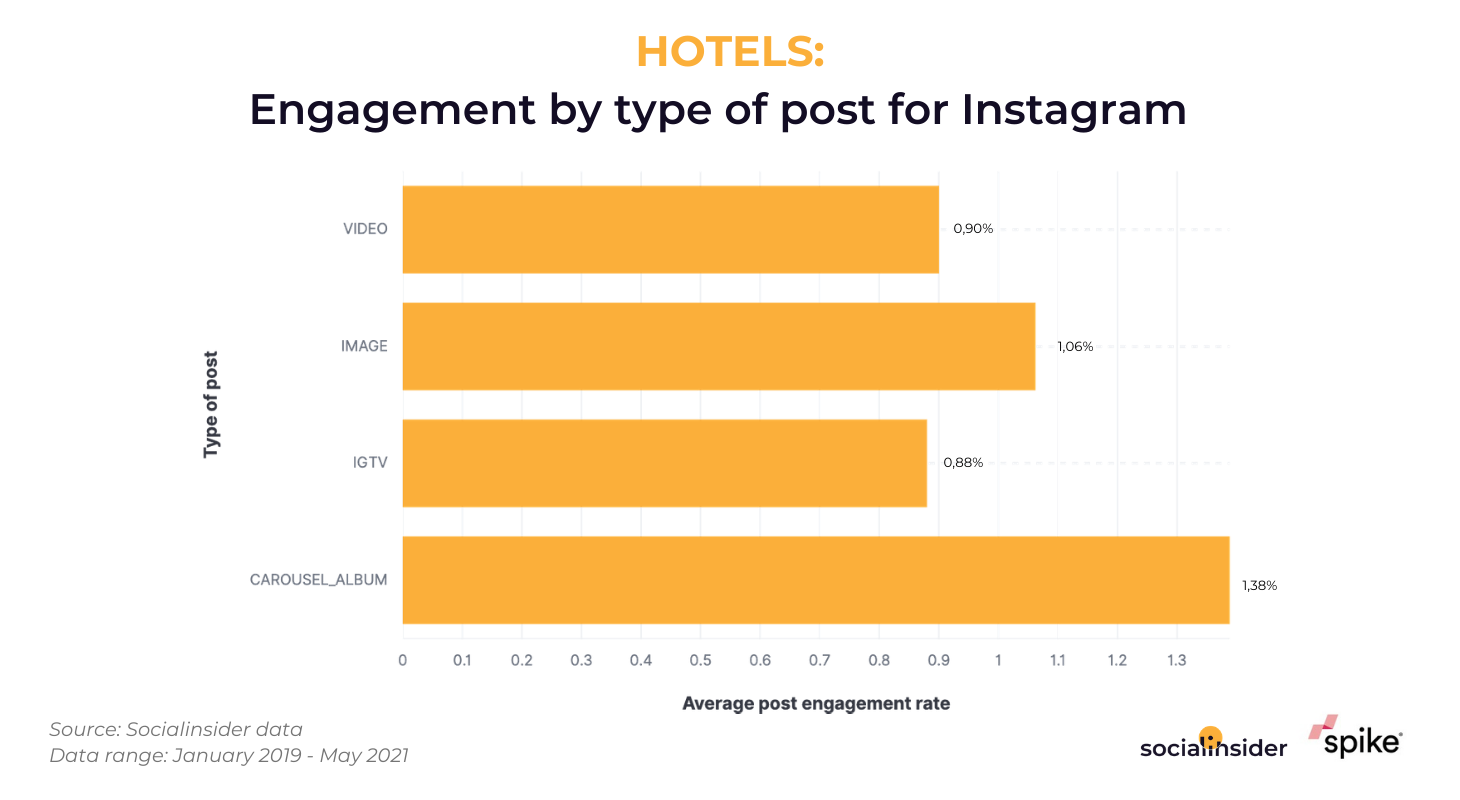
On Instagram, like in the previous segment, carousel is the go-to type of post, capable of reaching values of 1,3% average engagement rate.
Health & Fitness

Reaching the health & fitness industry, we can see it has significantly increased its popularity over the period analyzed, primarily on Instagram, growing from 0.88% engagement rate in 2019, to 1.30% nowadays.
With more and more people trying to adopt a healthier lifestyle, especially with the extra spare time, during the lockdowns, it was a natural uplift effect.
The tendency towards increasing was felt on Facebook as well, although the intervals were way less smaller than the ones on Instagram.
From an average engagement rate of 0.18%, at the beginning of 2019, it has reached values 0.69% at the beginning of 2021, slowly decreasing from then.
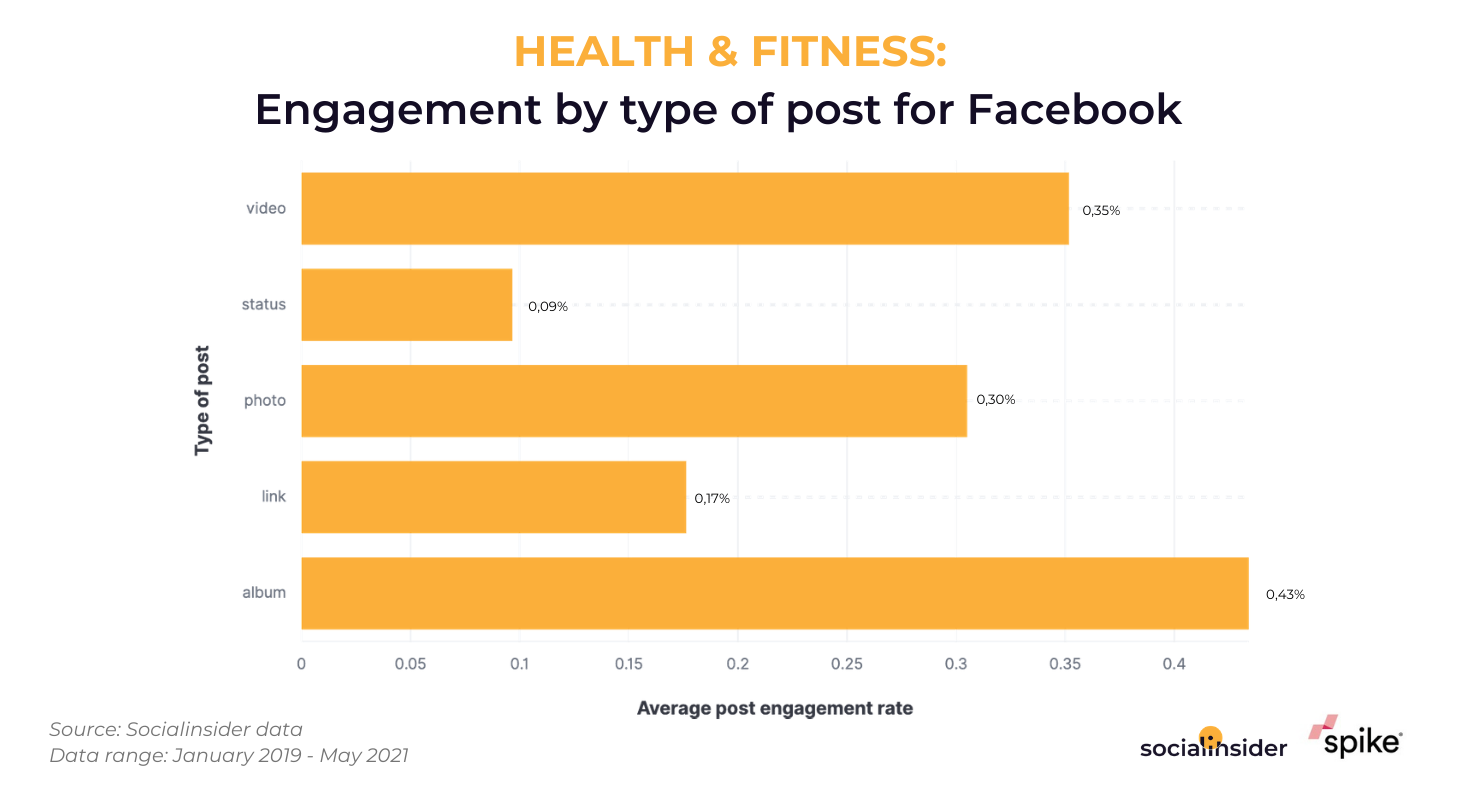
When it comes to the best type of post for reaching the highest engagement possible on Facebook, within the frames for this niche, it is recommended posting more albums.
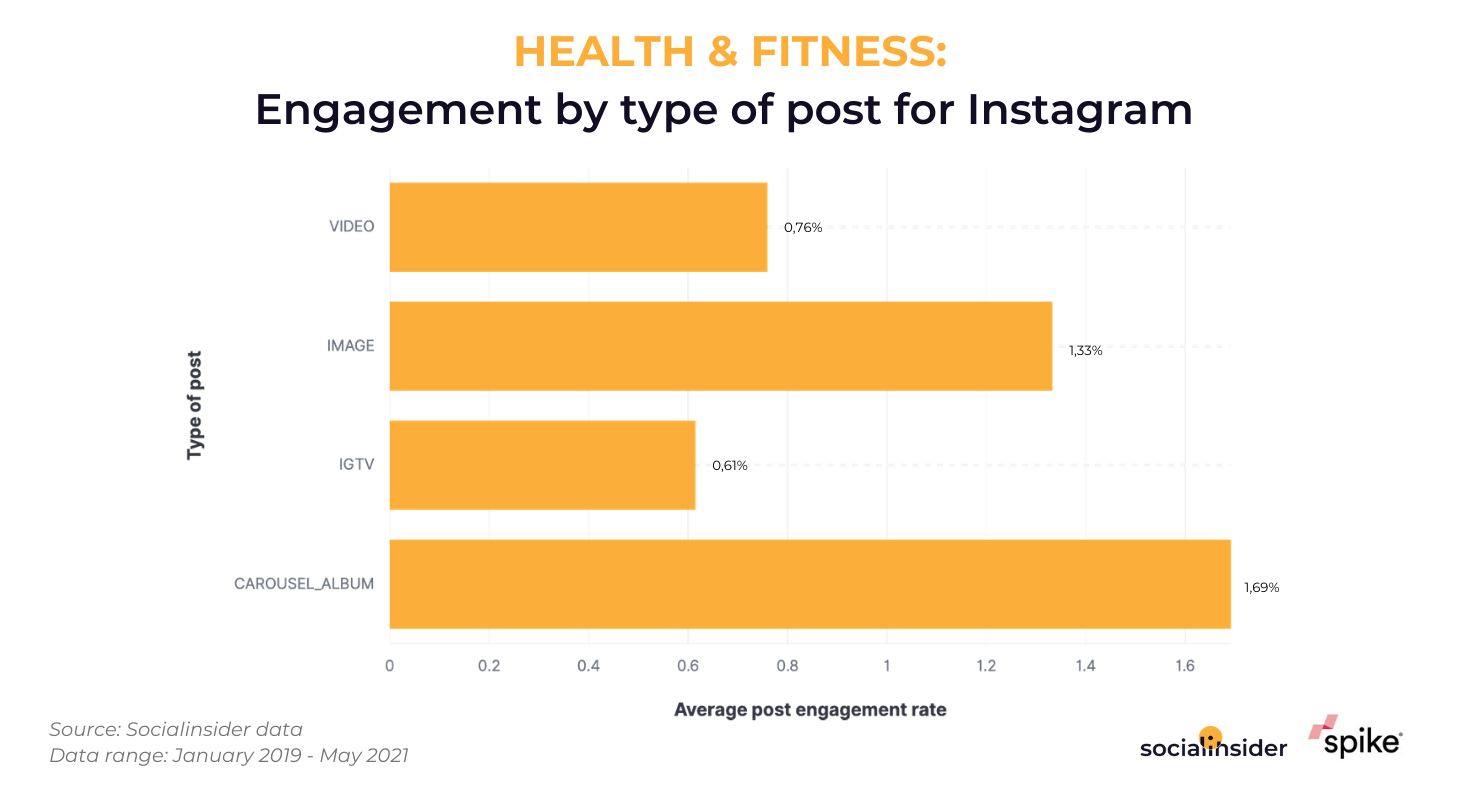
Once again, carousel is the preferred format on Instagram for generating an increased engagement. With values way bigger than Facebook’s, as we saw, it allows brands from the health & fitness segment to reach up values of 1.6%.
Jewellery
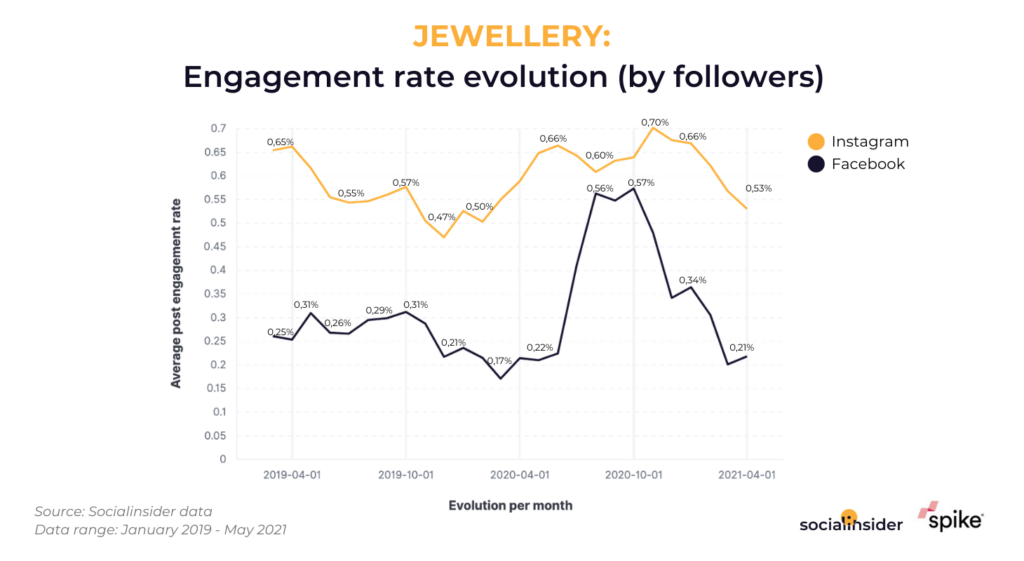
Among the industries presented, the jewellery category is the one with the lowest engagement rate on Instagram, currently being located somewhere around 0.53%. This is a rather interesting fact given its strong visual nature.
What’s also worth mentioning is that, starting with the first half of 2020, on Facebook, the jewellery segment has seen a growing wave, doubling its engagement, but only for a short period of time, subsequently decreasing back to the values from 2019, of 0.21%.
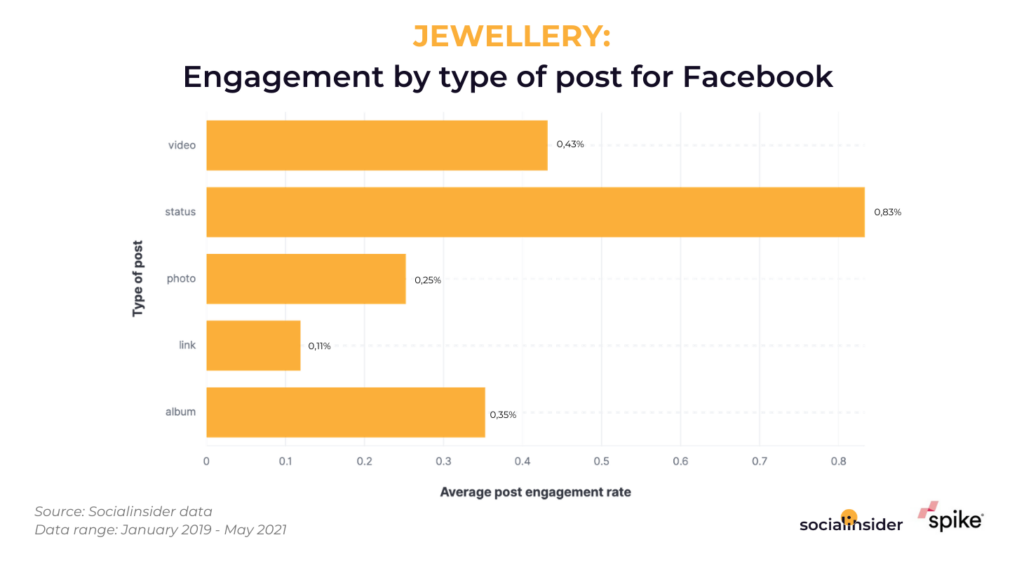
What comes as a big surprise, totally different from the tendency observed so far, for the jewellery industry, status is the type of post that generates the highest engagement rates, up to 0.83%.
Maybe some hot sales and discounts are the answer for this? It’s a matter that definitely stirred up our interest.
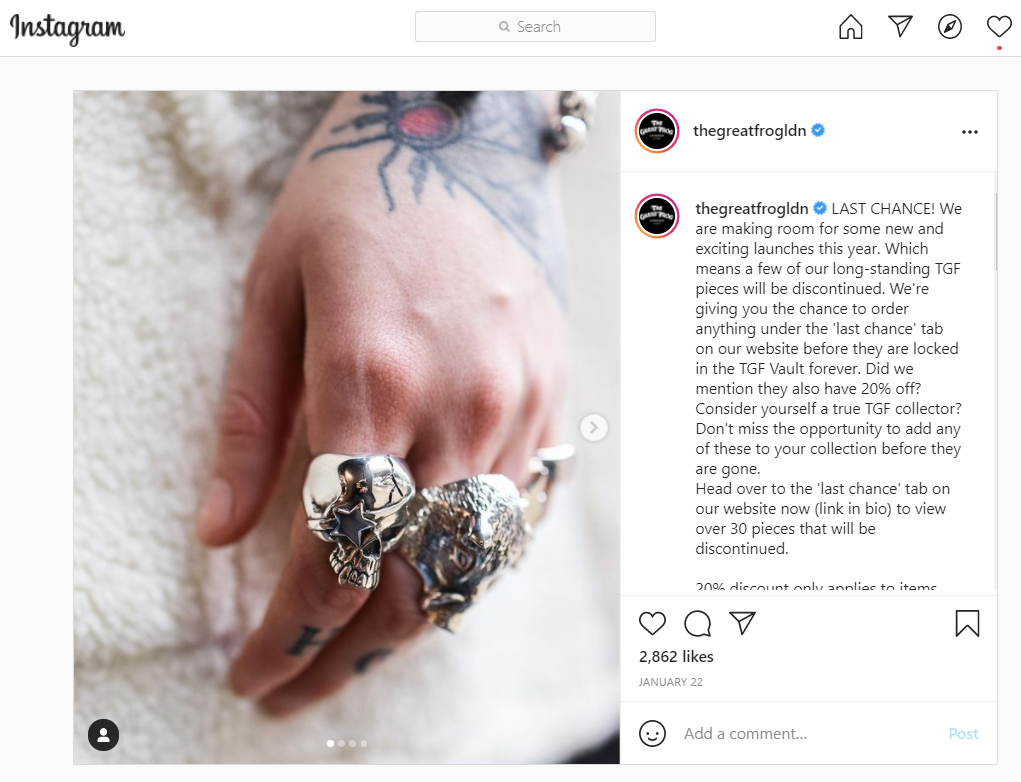
https://www.instagram.com/p/CKWpoeeLt24/
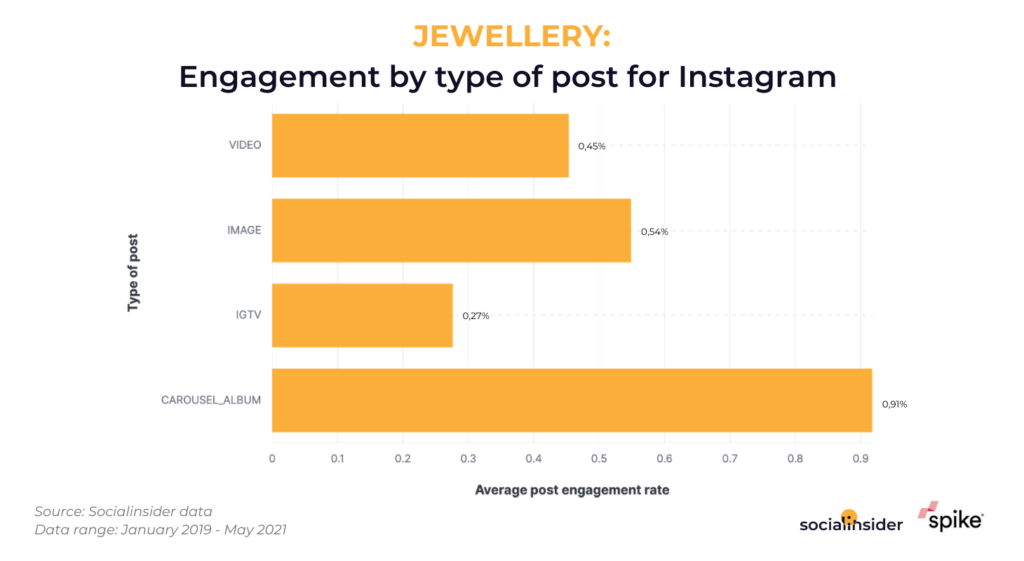
Given the carousel’s power to increase engagement on Instagram, it’s needless to say this is the type of post that performs best for the jewellery industry as well, up to a value of 0.91%.
Final thoughts
All in all, after seeing all this, the great influence of albums and carousels over the engagement rate on social media has become undeniable.
The aim of this study was to discover those starting points that could make social media managers working on brands from the UK improve their communication strategy.
Due to its fun and inventive nature, Instagram has been taking the social media landscape by storm, ending up being the most engaging social platform.
Brands can look to asking audiences questions which can inform potential PR campaigns and utilise the data to secure press coverage and backlinks to the desired domain.
Therefore, this has to be a big focus point for marketers that are looking to upgrade their social media efforts and bring about an integrated approach to social media and PR.